Housing Market Report: September 2021

The indicators for the National Housing market as of September reveal activity has improved overall. While it is still very much a seller’s market, there is movement as we see more homes come onto the market. There also appears to be a decline in the number of buyer bidding wars.
Chris Glynn, an economist at Zillow says, “Home price appreciation is difficult to forecast, but we expect home price growth to slow down from historic highs.” Zillow says the housing market is transitioning from “white hot” to just “red hot.”
In September, newly listed homes declined by 3.9% on a year-over-year basis, with sellers still listing at lower rates (12.6%) than levels we saw from 2017 to 2019. However, sellers in the previous five months were listing in more significant numbers than in 2020.
In September, newly listed homes declined by 3.9% on a year-over-year basis. Sellers are still listing at lower rates (12.6%) than were typical levels seen from 2017 to 2019, a change from the previous five months when new sellers were listing in more significant numbers than the previous year.
Median Home List Price
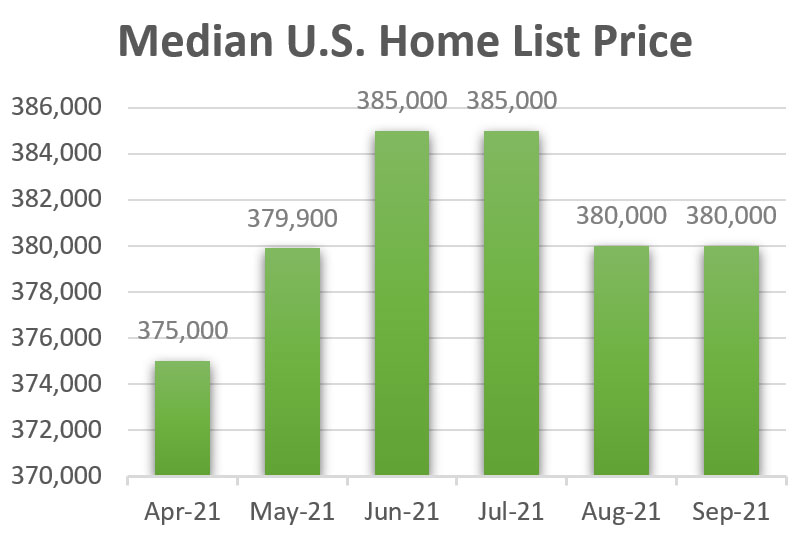
- The United States median home list price for September was $380,000, which was flat from August.1
- The median home list price is up 8.58% compared to September 2020. 1
- Zillow expects home values will grow another 4.4% through the end of the year and end 2021 up 19.5% from December 2020.2
- Zillow predicts home prices will rise 15.4% over the next twelve months.2
Home Supply
- For September, the total number of homes listed for sale in the United States was 1.3 million, down 12.6% from September 2020.
- The number of new weekly listings for September was 393,288, which is down 3.93% from September 2020.1
New Home Purchases Showed Modest Gains
- New single-family home sales increased 1.5% in August.
- Overall, new single-family home sales increased to 740,000 units in August, seasonally adjusted annual rate (SAAR) from July’s revised pace of 729,000 units. However, this is 24.3% lower than in 2020.3
Existing-Home Sales Declined Slightly
- The National Association of Realtors® (NAR) reports that August sales of existing single-family homes (including townhomes, condominiums, and cooperatives) fell 2.0% to 5.88 million units (SAAR) in August from July’s revised pace of 6.00 million.
- August’s existing home sales were 1.5% lower than in August 2020.3, 6
Days on the Market
- In September, the median number of days a home stayed on the market (from listing to closing or being taken off the market) was 43 days.
- Compared to September 2020, this is a decline of 11 days (-20.37%).1
New Home Construction Increased
In August, total housing starts increased 3.9% to 1.62 million units (SAAR), up 17.4% over 2020.
Single-Family Housing Starts:
- Fell 2.8% to 1.08 million homes (SAAR) in August from a pace of 1.11 million units in July.
- However, this is up 5.2% from 2020.1
Multifamily Housing Starts (5+ units):
- In August up 21.6% to 530,000 units (SAAR) from 436,000 units in July.
- Up 60.1% from 2020. 1
Year-Over-Year Home Price Increases Continue to Accelerate
- The Federal Housing Finance Agency (FHFA) seasonally adjusted purchase-only house price index for July estimated that home values increased 1.4% from June and 19.2% from 2020. That is up from an 18.9% annual gain in June.
- July is the fourteenth straight month that annual house price gains have accelerated.
- S. home values are now 55% above the peak set in April 2007 during the housing bubble.3, 7
The Inventory of New Homes for Sale Increased
- The listed inventory of new homes for sale, at 378,000 units at the end of August, was up 3.3% from July and 32.2% year-over-year.
- That inventory would support 6.1 months of sales at the current sales pace, up from 6.0 months in July.
- Available existing homes for sale, at 1.29 million in August, were down 1.5% from July.
- Available existing homes for sale were down 13.4% from 1.49 million units in 2020.
- The listed inventory represents a 2.6-month supply, the same as in July due to slower August sales.1
Homeowners’ Equity Showed Substantial Gains for a Third Straight Quarter
- According to the Federal Reserve estimates, homeowners’ equity (total property value less mortgage debt outstanding) was up $880 billion or 3.9% in the second quarter of 2021.
- Homeowners’ equity increased $817 billion over the first quarter of 2021, totaling more than $23.6 trillion.1
The 30-Year Fixed-Rate Mortgage (FRM) Rose Above 3%
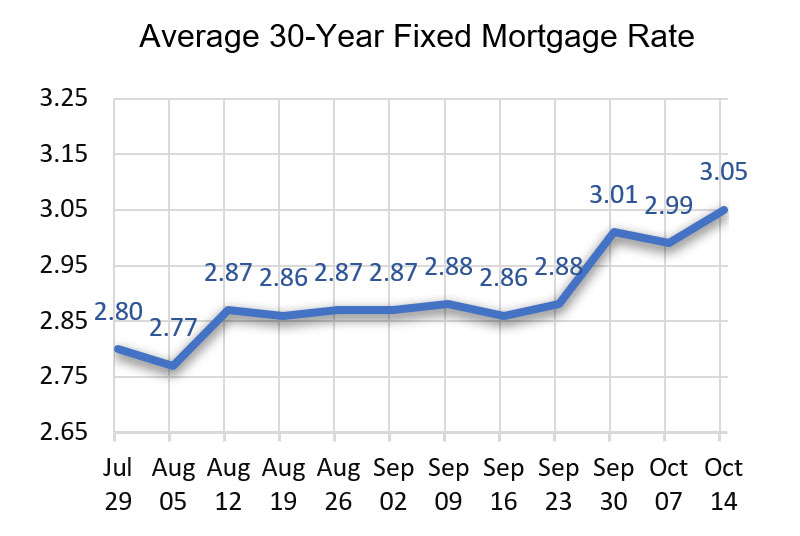
- The 30-year FRM reached an average weekly low of 2.86% in September.
- The previous low of 2.77% was for the week ending August 5.
- The 30-year FRM rose to 3.01% the week ending September 30.
- The 30-year FRM was 2.88% one year ago.
- The record weekly low interest rate was 2.65% for the week ending January 7, 2021.4, 5

Sources:
1 Realtor.com residential listings database
2 Zillow
3 HUD Housing Market Indicators Monthly Update, September 2021
4 Freddie Mac
5 FRED, Federal Reserve Bank of St. Louis
6 Because existing home sales are based on a closing, August home sales reflect contract signings in June and July. Interest rates are low, but lean inventories and house price growth are constraining sales.
7 Federal Housing Finance Agency (FHFA)
